Site speed has become the topic of choice in the blogging world. Google is pushing it hard with their Core Web Vitals metrics. Speed is the last piece of the puzzle to the overall page experience on your site that they have been working towards.
Core Web Vitals completes their push towards a mobile-first search experience. So while desktop still has its place, from now on assume mobile is the king for your website and desktop is the annoying cousin that still hangs around but you wish would just go away.
Readers are after all short on time and patience (and at times bandwidth on their mobile device), so if your site isn’t loading instantly they’ll go somewhere else. I know you do it, I do it too. As soon as you see the page failing to load up, that page is closed and your back looking at the next result that showed up in your search.
So how do you test your site speed with the Google’s Page Speed Insights tool? And even more importantly, decipher the report you are shown once it’s finished?
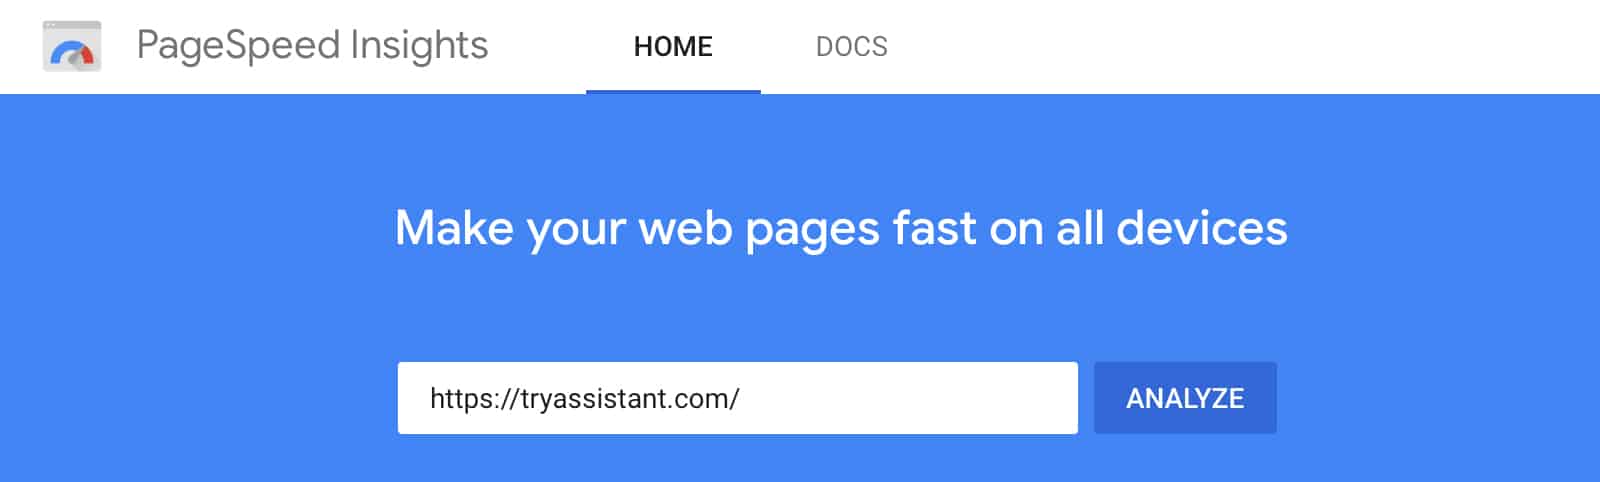
The how is pretty simple, open up the website and drop your website url into the search box and click analyze.
Now when you run a test be sure to test more than just the homepage. Readers to your site will most likely arrive via a blog post but often people will only test their homepage and think if it’s good the rest of the site is too. It’s not.
So test a whole bunch of your blog posts. I recommend picking 5 different blog posts to get a good sample size along with your homepage.
Another good way to find URLs on your site that might be underperforming is to look up your Core Web Vitals score in your Search Console dashboard. The data found there will be the most complete in terms of what pages are good and what is bad for you to work from.
You can’t just run the test once and call it a day either. I like to test a site over a couple of days and at different times of the day to get an idea of the average rating for the site when really digging into the speed of a site. This helps to weed out general fluctuations in your server and overall internet performance.
With the tests run you’ll see a pattern as to which items might be giving your site the most problems broken down in both Mobile and Desktop instances. We are only going to concern ourselves with Mobile performance, fixing it will also fix the Desktop concerns.
At the top of the page, you’ll be given an overall score out of 100. Obviously the higher the better here.
The data of the report below that number is what we are more interested in and will be presented to you in this not so simple table of information full of big words that don’t make a lot of sense to the average blog owner.
Let’s try and decipher some of these field titles so you know what is important and what isn’t before getting to the rest of the page’s information.
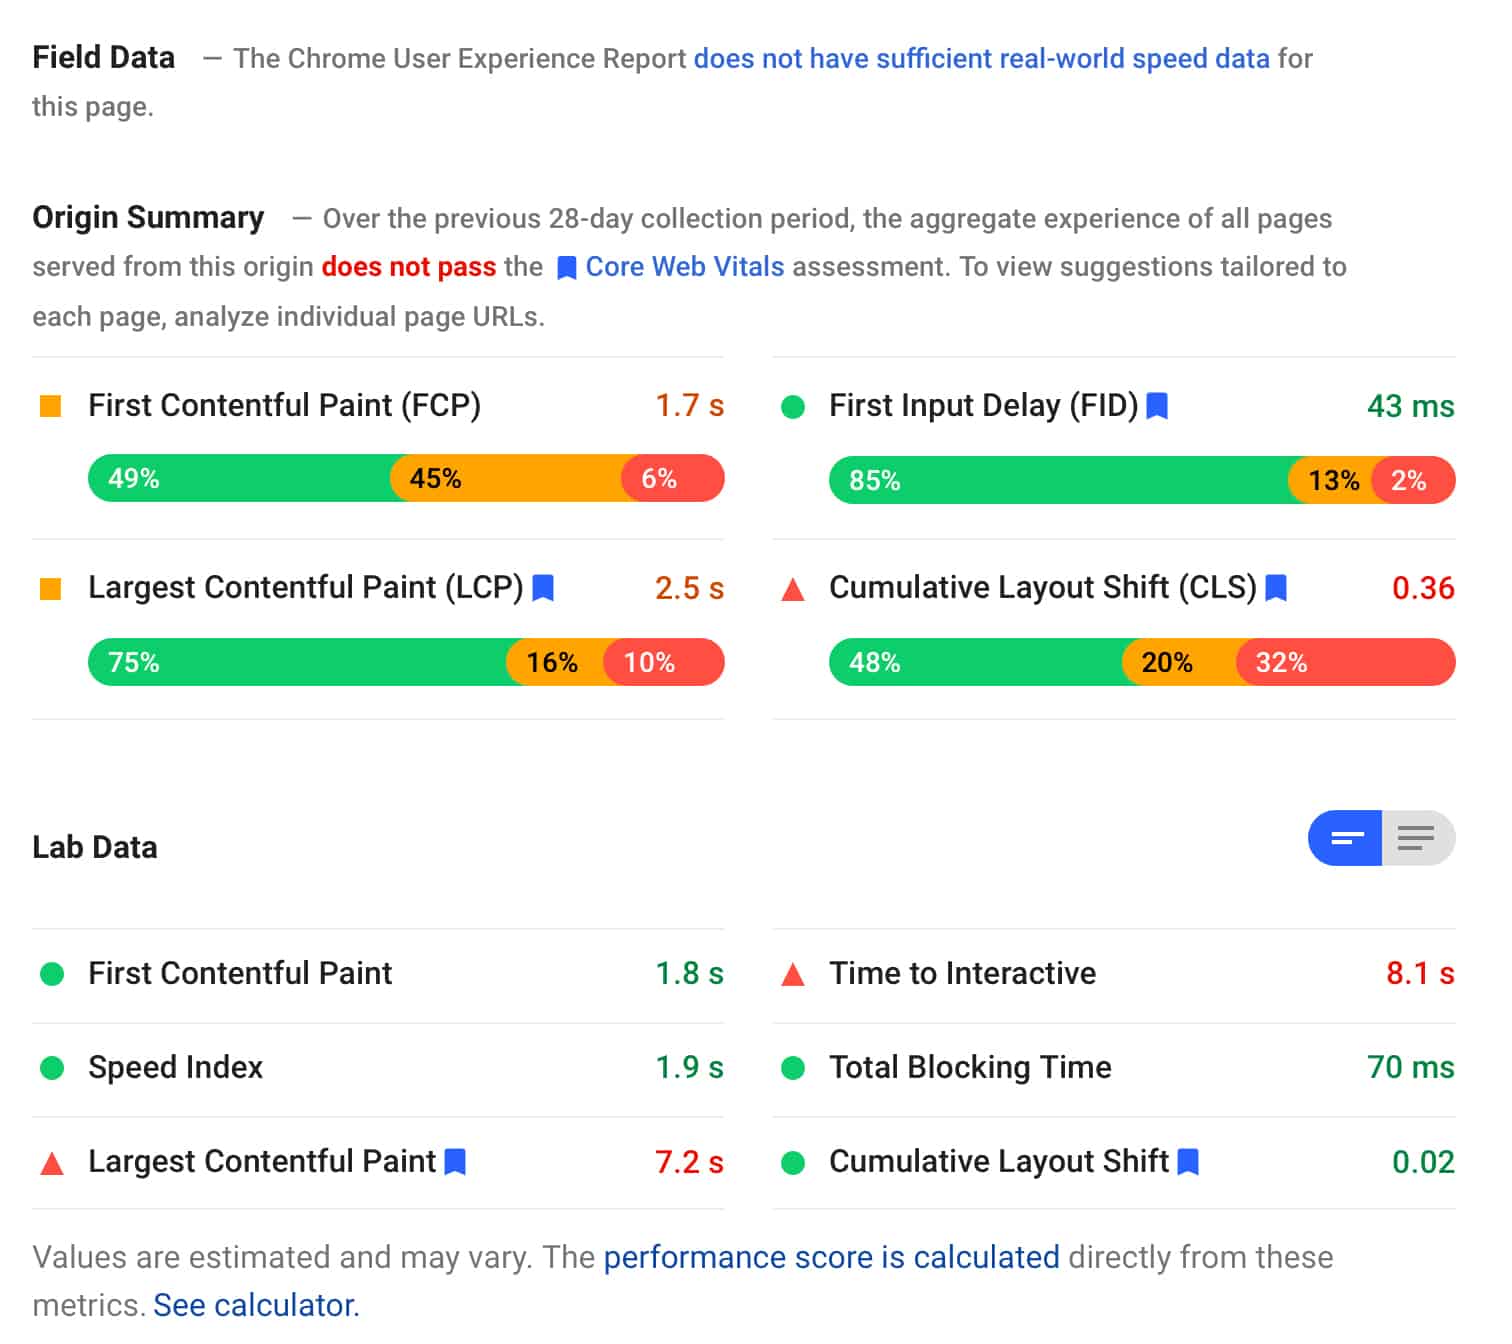
Field Data
Reports back on real-world data gathered by Googles Chrome User Experience Report for that specific page. This data is collated from people who have “opted-in to syncing their browsing history, have not set up a Sync passphrase, and have usage statistic reporting enabled” in their Chrome browser. Unless your site is generating a lot of pageviews it’s common to see this not report data for every page of your site.
Origin Summary
Your origin summary report however will give you feedback from the last 28 day collection period as an aggregate for your whole site as opposed to an individual page. This is Google lumping all the pages on your site into one averaged result from the data they have collected. That collated data is then used to say if you pass or fail the Core Web Vitals test.
Lab Data
This is your performance as analysed by the site speed test you’ve just run. You’ll find this data can vary greatly from the origin summary above. And is again a reason we test multiple pages on your site to help find the slower pages that might be dragging your average down. So pick your test pages well from the variety of blog post content you have. Grab a page with a video on it, a page with lots of images etc.
Out of all of the data reported, we care the most about the following 3 metrics and how they will affect our page speed performance (often denoted in a speed test with the little blue flag).

Largest Contentful Paint (LCP) – Represents the time it will take to load the largest element on the page. This could be an image, video or some other content element. You want this to be loaded within 2.5 seconds or faster.

First Input Delay (FID) – Represents the time it takes for a user to be able to interact with your site. As in click a link or menu item and have the site respond to that request. Here you are looking for a reaction time of less than 100 ms.

Cumulative Layout Shift (CLS) – Represents the amount of moving around elements make as they load on the page. You often see this as ads or images load on a page and push text down out of the way when they appear. For this, you are looking to score at 0.1 or lower.
Now that we know generally what’s going on with a page speed report and what we do and don’t care so much about, how do we fix it?
Let’s take another look at the rest of the page speed report data we gathered from our scan. This is a break down of our site content and how specific elements are impacting your site.
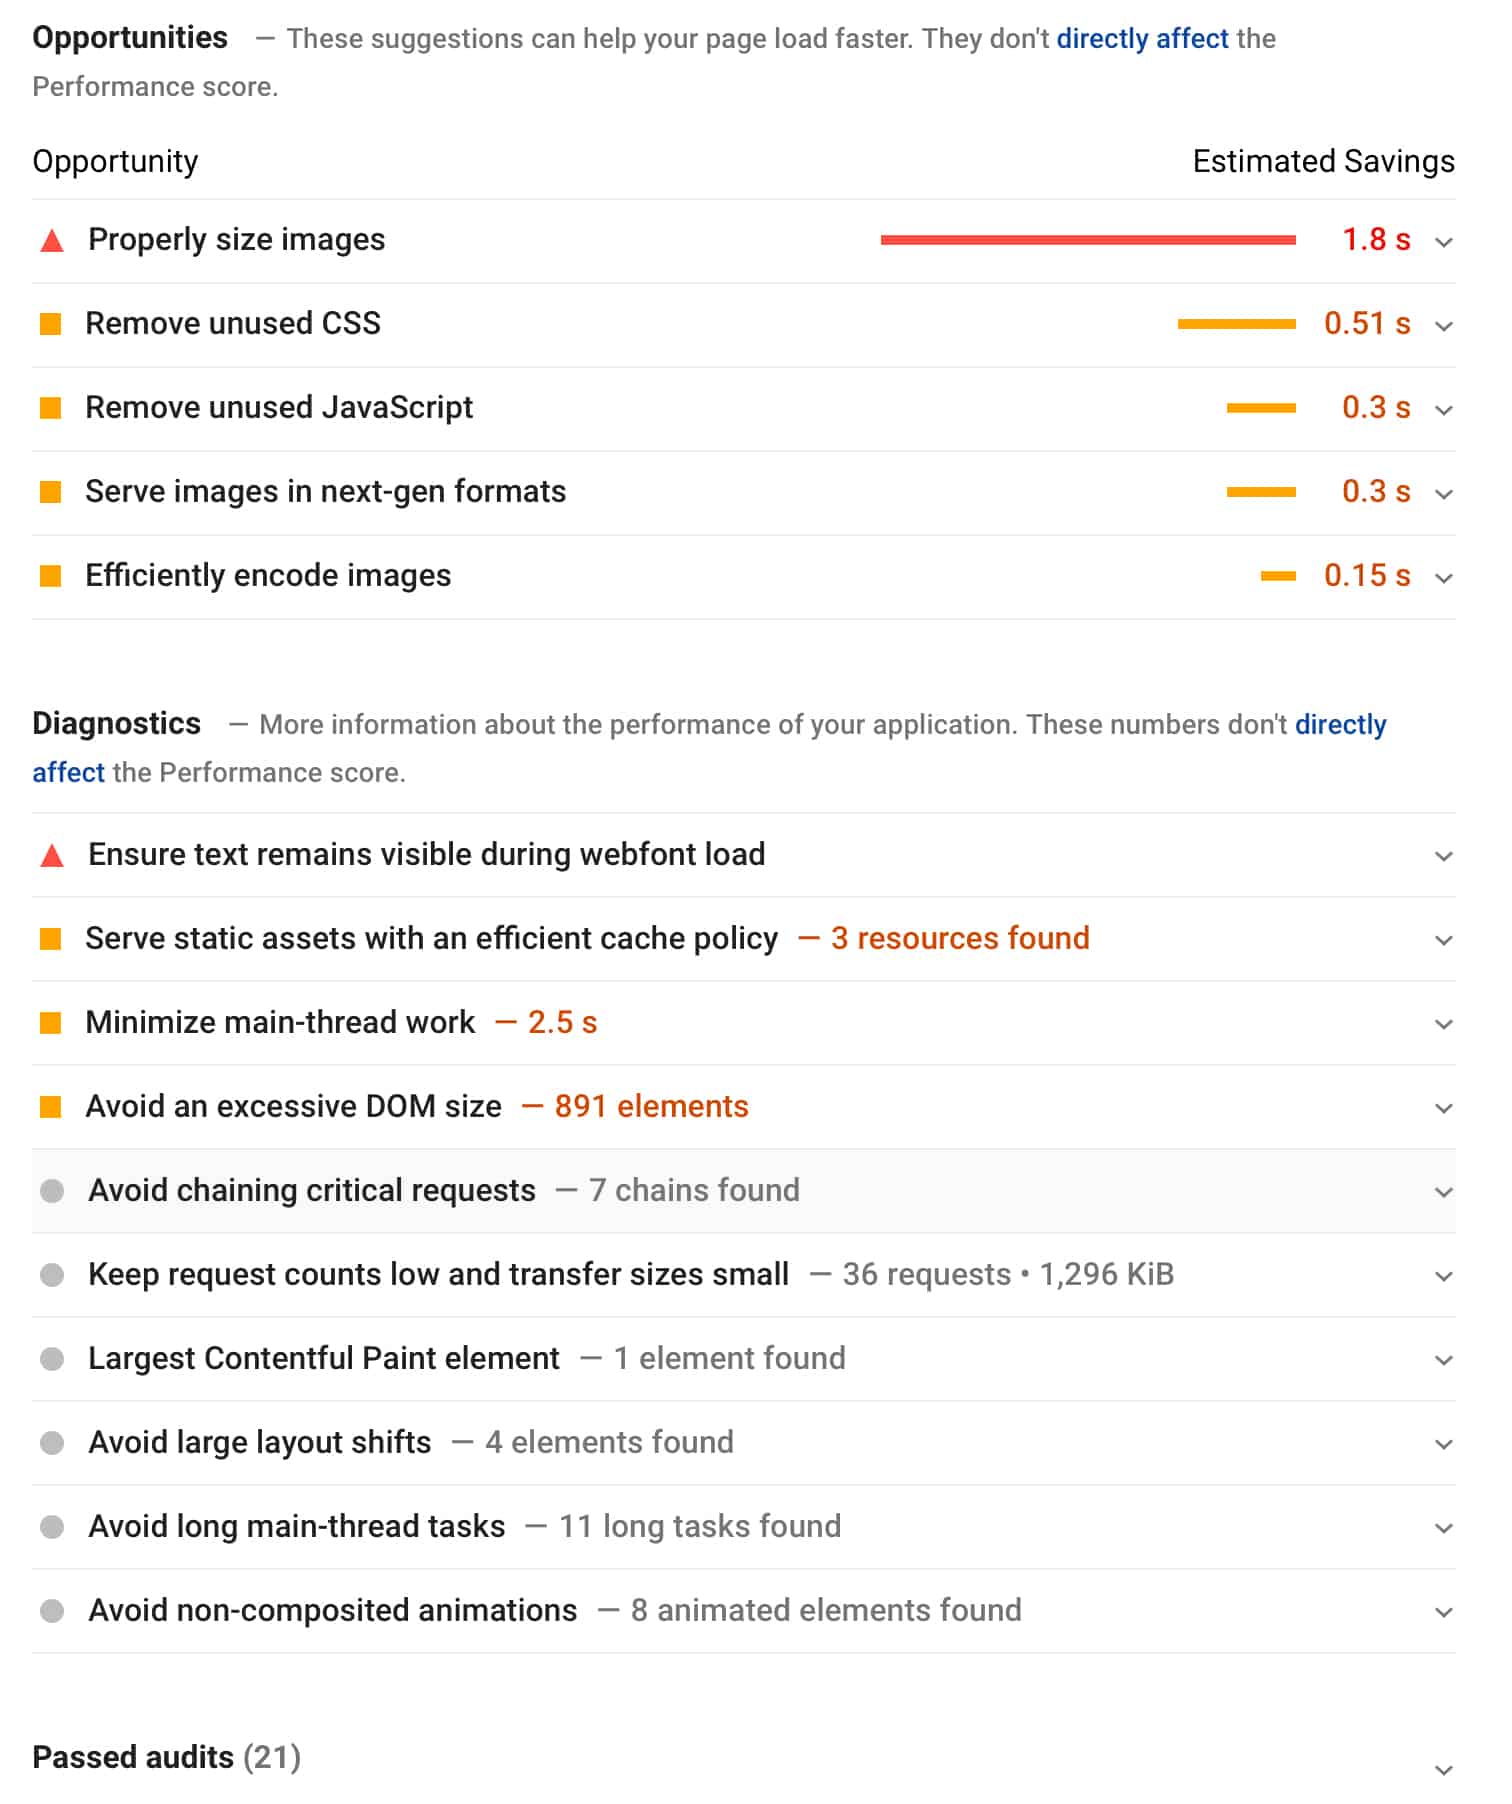
For reference, the most common “Opportunities” as they are called that you may see in a page speed scan are below, but as you can see from above there are many others along with Diagnostic data as well that starts to get really tech-focussed. The main ones below tend to have the biggest impact on your site and can be most easily fixed:
- Reduce initial server response time
- Eliminate render-block resources
- Remove unused JS or CSS
- Properly size images
All of that translates into the below items that may be having an impact on your site speed.
- The performance of your web hosting server might be suffering or not performing well
- How much Javascript and CSS styling your theme, plugins or 3rd party services (ads, tracking scripts etc) might outputing at the top of the page
- Javascript and CSS from your theme, plugins or 3rd party services that are not being used on that specific page
- The size of images you upload to your site. Both in data size and canvas size
OK let’s bring it all together into something you can action on your site knowing which opportunities will improve the key metrics we really care about.
Improving your Largest Contentful Paint Score
As we highlighted above your LCP score is tracking how long it takes to load the largest elements on your page. So to improve that you want to work on reducing the impact delays and large elements have on your site.
To do that make sure you have a good web host ($5 a month hosting is not what would be considered great) and that you are hosting your site as close to the bulk of your readers as possible. If all your readers are based in Europe for example but your host your site in America consider moving it to Europe instead.
Lazy load your images and embedded videos so only the images or videos you see as soon as you land on the page appear. As a reader scrolls down the page, the other elements will begin to load the further down you scroll. This can really improve a users mobile experience on image-heavy posts.
Compress/resize/crop your images before uploading them to your website. Don’t just drag the image off your camera and upload to your blog. By creating a good workflow for image editing you not only improve your site speed but it allows you the time to crop an image for the best impact on your site as well.
Minify Javascript and CSS code on your site by using a caching/optimisation plugin that supports this feature.
Improving your First Input Delay Score
FID measures the delay between when a user can first click on a link or button and your browser responds to it as the page is loading.
The main cause for a delay in response time is Javascript loading on your site. This could be from a featured image slider, ad code, 3rd party tracking scripts loading up or email popup and chatbots. Where possible limit these elements on your site unless needed.
Taking it a step further also try to only load Javascript code and any specific code really on the pages it’s needed. If you have an email popup that only works on the homepage make sure that code only gets output on the homepage and not loading its styling and code in the background on the other pages as well but being blocked from showing since it’s not the homepage.
The less reliant you are on code loading from other websites and fancy effects that require Javascript to work the better your user experience will be with your site too.
Really large images or large javascript library files will also have an impact on your FID as the files need to first be downloaded before they can be executed by your browser.
Improving your Cumulative Layout Shift Score
Layout shift on a web page as it loads is possibly the most annoying of them all. You go to click a link and all of a sudden its moved down and something else has appeared in its place (usually an ad) and thats what you’ve accidentally clicked instead.
Reducing the impact of CLS on your site means ensuring all elements on your site have defined sizes so they keep their size even if the actual ad, image or video is yet to fully load on the page.
When you insert an image via WordPress it should have its size defined for you unless you’ve placed the image manually via custom html. Videos that are often embedded via an iframe may need some extra html applied to ensure they get their correct sizing.
Ad blocks are one of the main offenders to this layout shift you see. Thankfully many of the big ad networks have started to address this issue. As you enable those options on your ad profiles you should start to see an improvement in your CLS scores.
That’s a lot to take in and many of you might be thinking, there’s no hope for me this is all still just too confusing. As such, I also want to mention that while site speed is important content is and will always be king. The fastest and cleanest site is nothing without well researched and valuable content to share with the world. After all, we use a search engine to find the answer to a question so that means having content. Don’t feel like you have to go all-in on the speed of your site or feel like you’ll be left behind, it’s just not true.
The key takeaway I want to leave you with is to keep a balance in mind and optimise your site by fine-tuning what you can while staying true to your site and the brand you have built.
If working on your site speed is something you want or need to do but are just not confident enough to undertake yourself then we have a service that can audit your site and help you improve it. Head over to our Site Speed Audit Service page and signup and we’ll be in touch to help you out.